
Air Quality Specifications
Various Specifications are issued by various different Navies and Shipyards. Following are some examples:
Salt

Solid Particles

Water
We see drawbacks with the above specifications, as they do not allow for a direct measurement, nor a straightforward comparison across different systems.
Our recommendation is to refer to 5 basic parameters:
- Initial Water Droplet Efficiency (“iWDE”) of the system
- Water Removal Reliability (“WRR”) of the system
- Initial Solid Particles efficiency (“iSDE”) of the system
- Initial Pressure Drop (“iDp”) of the system
- Dust Holding Capacity (“DHC”) of the system
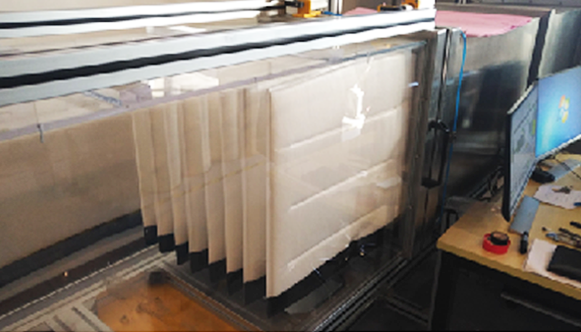
The filter shall be tested against water mist as follows:
- Air velocity should be the same as in the real application (eg. 6m/sec or 8m/sec)
- A high pressure atomization spray nozzle positioned approx. 2m upstream the filter, should be used to generate water mist with following specifications:
– approx. 0.5 litres per minute at approx. 3.5bar pressure
– Range of droplets: 0.8 to 50micron, with peak at 1.2-1.5micron - Water droplets shall be measured upstream and downstream the filter with Aerosizer
Not only this test allows to compare the water droplet efficiency between various systems, but it also allows to:
- Compare the droplet efficiency at various air velocities
- Identify the salt efficiency in soluble form (since in wet state, salt travels with water, therefore the soluble efficiency of the filter is very much the same as the droplet efficiency)
- Be able to calculate any possible water/salt ingress in relation to the assumed upstream conditions in ppm or any other unit
The following chart shows an example of output from this test:

The filter shall be tested against ISO:29461-2 water test at the selected air velocity (eg. 6 or 8m/sec):
- No water shall pass through
- The Dp shall remain stable
This test is to make sure of the water (and salt in wet state) removal reliability of the filter.
The filter shall be tested against KCl salt particles, which represent both salt particles in dry state and any other solid particle. This is a common test, performed as follows:
- Air velocity should be the same as in the real application (eg. 6m/sec or 8m/sec)
- Generate KCl salt particles upstream as per Ashrae 52.2
- Measure KCl salt particles and downstream the filter with particle counter as per Ashrae 52.2
Not only this test allows to compare the dry salt and solid efficiency between various systems, but it also allows to:
- Compare the efficiency at various air velocities.
- Identify the salt efficiency in dryform
- Be able to calculate any possible dry salt/solids’ ingress in relation to the assumed upstream conditions in ppm or any other unit
The following chart shows an example of output from this test:
The initial pressure drop is very easily measured across a filter at various air velocities.
The iDp is critical for the overall comparison of iWDE and iSDE charts across different systems.
The dust holding capacity of a filter provides an indication towards its life, especially when operated in dusty and sandy environments.
For the purpose of comparing different systems, we recommend to refer to common EN or Ashrae test standards, making sure that the test reports being compared uses:
- The same type of dust (Ashrae or ISO dust)
- The same air velocity (eg. 4m/s or 6m/s or 8m/s)
- The same final Dp (eg. 650Pa)
- Similar Temperature and RH during the test
It is important to realize that in absence of the above, a comparison across different systems can be unfair or biased.